 |
| home | features | products | how to buy | training and support | about us |
| home>projects>tower hamlets noise map |
| what is noise ? what is noise mapping ? what is a noise model ? eu noise directive uk legislation news links projects search |
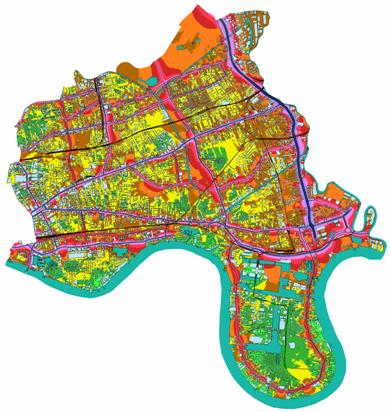
London Borough of Tower Hamlets Noise Map NoiseMap was used to create the first noise map of a London Borough in 2001. The noise map is based on a three-dimensional computer model of the Borough and includes the 50 busiest roads and all the buildings alongside them including the Tower of London and Canary Wharf.
As the map is based on a computer model, the Borough can make changes to the model to see what effect it has on noise levels. This lets them test the effect of developments in the Borough and thus plan noise mitigation strategies. The model can also be extended to include other roads and other noise sources when the resources become available. |
phone: +44 (0) 20 3355 9734 |
email: info@noisemap.com |